使用MMS维护道路
Accurate and Detailed 3D Models Using Mobile Laser Scanning
一个移动映射系统(MMS)可以从面包车或其他移动平台收集路线及其附近的激光数据和图像。在这里,作者描述了在芬兰进行的飞行员的数据收集和准确性评估。已经证明,使用复杂软件处理的MMS数据非常适合道路维护任务,因为可以从3D模型中准确计算许多参数。
An MMS survey enables highly detailed mapping of roads and their direct surroundings with high accuracy and within a short period of time, while minimising nuisance to traffic and risks of accidents. To prove its aptness for road maintenance, a pilot was conducted aimed at assessing the accuracy of the 3D model, determining road damage and deformations and using the 3D model to design the renewal of the road surface. Furthermore, the MMS survey delivered essential input for the resurfacing machine.
Data Collection
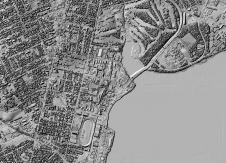
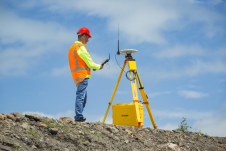
芬兰东南部的国家公路6(NR6)的22公里长的两车道部分被捕获,由两架RIEGL VQ-250扫描仪,四个摄像机组成,其中一个三台摄像头,一个记录道路表面,三个指向前进 -以及用于定位目的的Applanix POS LV 520。两条车道大部分都被森林接壤,都被捕获,即以50至70 km/h的速度捕获。为了进行地理发电,将地面控制点(GCP)涂在路的三个部分的两侧,间隔为50m,并使用Trimble R10 GNSS和DINI级仪器进行测量。每个部分的长度为500-600m,因此总共将74个GCP放置。使用Terrasolid的Terrascan,Terramatch,Terraphoto和Terramodeler进行了处理。这些模块在Bentley的微观刺激之下运行。
准确性
A major source of errors is the blocking of GPS signals due to tunnels, buildings, trees, rocks or other obstructions near the road. These errors could be corrected using the GCPs and the overlap between the forth and back recordings. To determine the relation between the number and distribution of GCPs versus accuracy, the number of GCPs was systematically reduced from all to a spacing of 500m (Table 1).
Raw data |
All GCPs |
GCP间距 |
|||
100m |
200m |
500米 |
|||
Z average magnitude |
12.8 |
0.1 |
0.3 |
0.5 |
2.5 |
Z标准偏差 |
0.1 |
0.5 |
0.7 |
1.9 |
|
XY平均幅度 |
7.4 |
0.7 |
1.3 |
1.8 |
2.4 |
表格1,Relationship between accuracy [cm] and spacing of GCPs.
A GCP spacing of 100 to 200 metres provides good accuracy, but with coarser spacing the accuracy diminishes quickly due to the non-linearity of the drift of the raw trajectory positioning. For high-accuracy work, the spacing should not exceed 50m for elevation and about 250m for planar coordinates. In addition, the elevation of the GCPs should be measured using a levelling instrument to obtain high accuracy.
Road Surface
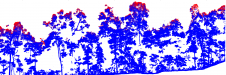
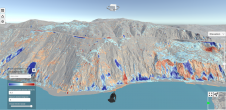
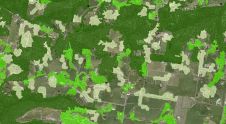
在匹配第四和背部录音之间的重叠之后,将自动删除所有非道路点。生成具有1厘米地面样品距离(GSD)的矫形模拟物,以支持对道路损坏和先前的维修工作的检测(图1)。然后将中心线和路边边缘从组合的激光数据和矫形器手动数字化,从而产生准确的向量数据集。中心线和边缘线用于创建一个表面模型,该模型能够从车辙和坑洼的激光数据中提取至少2cm的深度。路面箭头和斜坡的梯度可视化人行道内部和外边缘(超级高度)之间的垂直距离(图2)。图3显示了七类本地斜率梯度:红色表示小于1%,橙色1%至2%,黄色2%至3%,黄绿色3%至4%,绿色4%至5%,蓝绿色5%至6%和蓝色大于6%。具有较高梯度的区域会干扰驾驶条件,但也会有快速的水径流,而水将在平坦的区域停留更长的时间。
道路维修
The survey revealed an urgent need for renewing the asphalt. Road-design software is not well equipped for processing massive point clouds. Therefore the original 3D model was thinned and used for creating a new design surface which was imported into a machine control system and used for resurfacing the road. In addition, the data allowed an accurate estimation of the amount of materials needed for the surface renewal activities.
总结说
Future solutions may include line-of-sight analysis (Figure 4), calculation of road-surface roughness and cross sections, automatic vectorisation of paint markings and road break lines and detection of objects in the vicinity of the road.
致谢
感谢Terrasolid Ltd的Kjell Tuominen和Arttu Soininen,以及NCC Roads Ltd的Manu Marttinen。
进一步阅读
www.terrasolid.com/download/presentations/2012/mobile_accuracy_and_control.pdf
Figure Captions
Figure 1, Potholes, ruts and other deformations with a depth of at least 2cm are shown in blue.
Figure 2, Super-elevation: the blue line marks the location of the road section (bottom)
Figure 3, Centre and edge lines are shown in white and local slope gradients shown as classes.
Figure 4, Objects blocking sight (orange); red numbers indicate the distances to an obstruction for which a driver will be unable to stop in time when driving at a speed of 100km/h.
使您的收件箱更有趣。添加一些地理。
Keep abreast of news, developments and technological advancement in the geomatics industry.
Sign up for free