密集的图像匹配
斜图像的性能分析
使用密集图像匹配的3D重建是一个热门话题,因为它可以自动提取3D城市模型,尤其是从机载倾斜图像中。然而,由于大规模的变化,照明变化和许多阻塞,将昏暗的算法应用于倾斜图像是具有挑战性的。在这里,作者提出了一种评估昏暗算法性能的方法,并显示了四个DIM软件包的初始结果:Agisoft Photoscan,Leica XPro SGM,OpenCV StereoSGBM等。
Dense image matching (DIM) aims at computing a depth value for each and every pixel of an image. This facilitates the generation of accurate and highly detailed digital surface models (DSMs). Until now, the studies performed on DIM have been mainly limited to nadir imagery, with only a few studies addressing oblique images. The methodology we have developed for the evaluation of DIM solutions applied to oblique imagery includes performance measures ranging from completeness and differences in image space to density and deviations from reference geometries in object space. Deviations to planes fitted through patches lead to an indicator for a single point cloud while deviations between the DIM output and reference points or profiles indicate performance of multiple point clouds, generally from different sources.
昏暗的软件
The four DIM solutions tested are mostly based on the semi-global matching (SGM) algorithm introduced by Hirschmüller (2008), and include:
-Photoscan来自Agisoft LLC,根据计算机视觉算法实施完整的摄影测量链
-XPRO SGMfrom Leica Geosystems, originally developed for DSM generation from ADS pushbroom data and later adopted to frame sensors, is not yet fully optimised for oblique images
-StereoSGBMfrom the open source library OpenCV consists of a simplified variant of the SGM algorithm and is limited to a radiometric resolution of 8 bit
-SUREfrom the University of Stuttgart and now distributed by its spin-off nFrames.
从立体声图像到达DSM到达的工作流程可以细分为五个阶段:(1)图像整流;(2)图像匹配和深度图提取;(3)点云生成;(4)DSM计算;(5)DSM纹理。两个DIM软件包Agisoft Photoscan并确保执行所有这些任务,因此在工作流程方面是最完整的(表1)。
任务 |
Photo-Scan |
立体声-SGBM |
SURE |
XPRO SGM |
图像矫正 |
V |
V |
||
image matching |
V |
V |
V |
V |
点云生成 |
V |
V |
V |
|
DSM计算 |
V |
V |
||
DSM纹理 |
V |
V |
表1,由测试的四个软件包执行的任务。
Site and Data
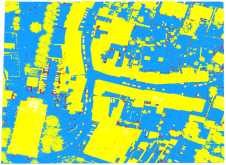
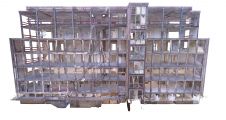
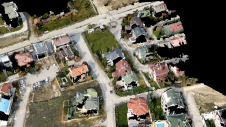
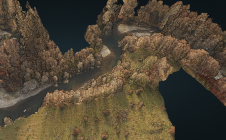
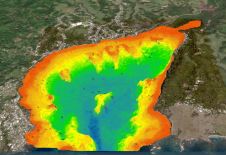
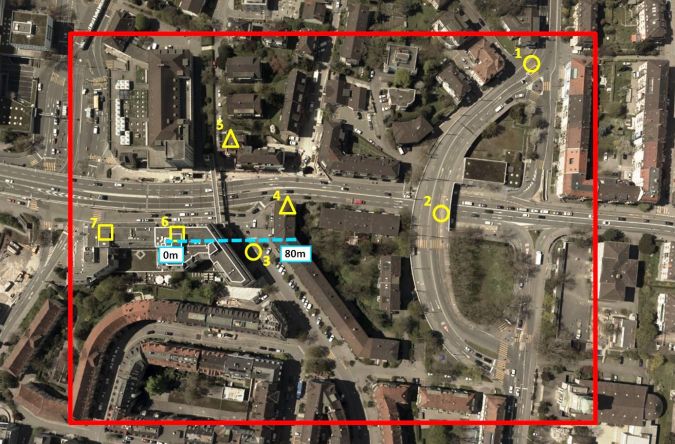
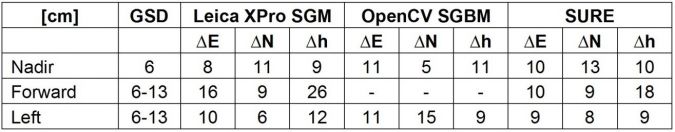
该测试区域覆盖了苏黎世韦斯特的5公顷(图1)。城市区域已记录在Leica RCD30斜五角处,该penta由五个摄像头组成,一个看上去的Nadir和其他摄像头组成,向后,向右,向右,向左,左右,倾斜角度为35度。每个头部的传感器尺寸为60MP,像素大小为6微米,辐射分辨率为14位。在520m的飞行高度下,使用70%/50%的Nadir重叠捕获图像。Nadir图像的接地采样距离(GSD)为53mm,为6厘米,斜图像的GSD范围为6厘米至13厘米。在匹配之前,精确地进行了图像。参考数据包括来自陆地激光扫描(TLS)的点云和从Leica ADS100数据得出的DSM。
完整性和深度差异
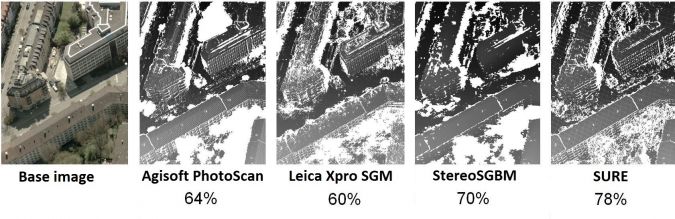
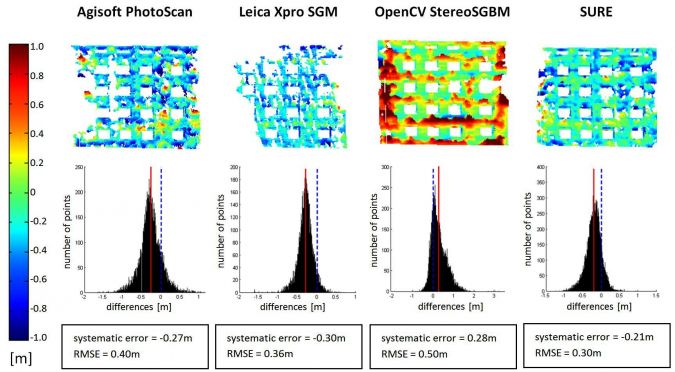
Completeness is the ratio between the number of pixels to which the software assigns a depth value and the total number of pixels. Areas covered by vegetation and shadows were particularly challenging. For the whole test area, SURE shows the highest completeness with 78%, and with 60% Leica Xpro SGM shows the lowest. Figure 2 illustrates the spatial distribution of the points for which a match was found for a 0.5ha cropping of the test area. Although the depth map of Xpro SGM shows fewer holes than that of PhotoScan or StereoSGBM, the percentage is lower as the point density in the matched areas for Xpro SGM is generally lower. Figure 3 depicts – in the form of maps, histograms and values – the depth differences for building façades generated from left-view DIM and TLS points. The systematic errors range from 21 to 30cm and the root mean square errors (RMSEs) reach up to 50cm. SURE shows the best results.
Scatter and Density
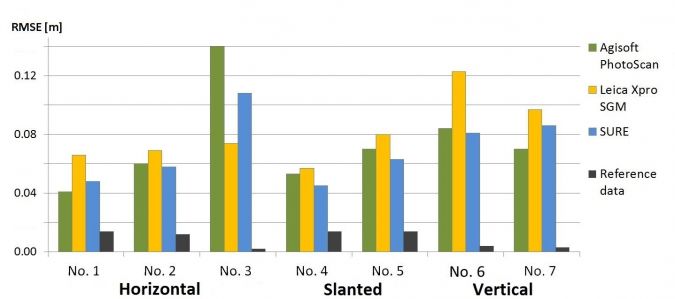
可以通过通过点云子集拟合平面并确定点和拟合平面之间的RMSE来计算散射。这里的水平,倾斜和垂直面积约为10 m2选择如图1所示,并分别针对由ADS100传感器和TLS捕获的DIM点和参考点计算RMSE。对于前视图,街道(水平)和屋顶(倾斜)斑块(阴影区域除外)的RMSE约为1 GSD(图4)。在立面(即垂直区域)获得了1-2 GSD的较大RMS。其他倾斜视图产生了相似的结果。进一步的度量是点云密度,该密度定义为每平方米平面上的投影点。
配置文件和点
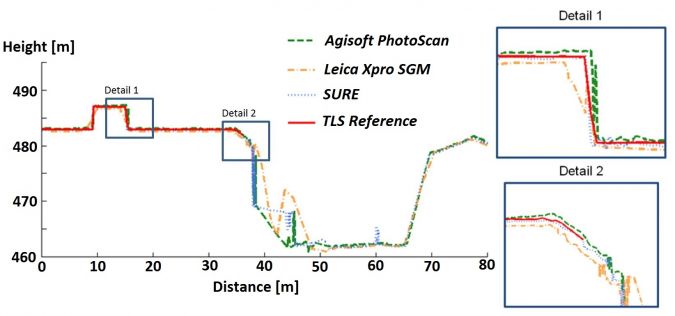
参考概况是一种用于分析匹配分辨率,潜在系统错误和准确性的验证方法。图5显示,TLS捕获的屋顶细节和斜视图捕获的曲线细节良好。建筑物阴影区域(围绕40m的轮廓位置)发生了更大的差异。比较不同点的3D坐标具有挑战性,因为参考数据应与点云产生的点,线和形状同源。因此,通过各个点云安装了三个相邻的平面,例如屋顶零件并相交。为了获得可靠的结果,散射应为低,并且每平面的点数足够。表2显示了同源点的绝对坐标差异的精度。平均而言,每个匹配项的坐标差异为12点,并且观看方向纳入了精度计算中。3D点坐标的RMS水平和垂直分别为1至1.5 GSD,最大约为2 GSD。
总结说
对于Nadir和倾斜的图像,绝对点精度的水平和垂直分别为1 GSD,相机头正朝飞行方向朝上,而1至2 GSD则是向前和向后倾斜的观察。事实证明,评估和比较昏暗性能的方法对于不同的图像匹配者,对于各种倾斜观看几何形状以及复杂的城市场景,包括建造立面和其他垂直结构,是有效且实用的。该方法的一部分将用于DSM计算的高密度图像匹配的即将到来的ISPRS基准中。
Acknowledgements
感谢Leica Geosystems AG(瑞士Heerbrugg)提供了准确的地理参与斜图像和参考DSM。
进一步阅读
- Cavegn,S.,Nebiker,S。和Deuber,M。(2014)密集的图像匹配MIT Luftbildaufnahmen - Ein Systematischer Vergleich Vergleich vergleichverschiedenerlösungenlösungenmit aufnahmen der der der leica leica leica leica rcd30 oblique oblique penta。在:DGPF TAGUNGSBAND 23 /2014,Gemeinsame Tagung 2014 der DGFK,der DGPF,der Gfgi und des Gin, Hamburg
- Deuber, M. (2014) Oblique Photogrammetry – Dense Image Matching mit Schrägluftbildern.硕士论文. FHNW University of Applied Sciences and Arts Northwestern Switzerland
- Gerke, M. (2009) Dense Matching in High Resolution Oblique Airborne Images. In:CMRT09,int。拱。摄影。遥感空间信息。科学。,卷。XXXVIII,第3/W4,巴黎,第77-82页
- Haala, N. (2013) The Landscape of Dense Image Matching Algorithms. In:摄影测量周'13,斯图加特,第271-284页
- Hirschmüller,H。(2008)通过半球匹配和相互信息进行立体声处理。IEEE关于模式分析和机器智能的交易,30(2),第328-341页
使您的收件箱更有趣。添加一些地理。
Keep abreast of news, developments and technological advancement in the geomatics industry.
免费注册